

Your Customer Success Toolkit. Always Watching. Always Ready.
From login behavior to renewals and hidden feature gaps—GoCSM is your agency’s silent success agent.
Built for HighLevel pros who want to act before the damage is done.
Think of it as your own 007—minus the tux, but twice as effective.
- Act early. Retain more
See who’s healthy—and who’s not.
Real-time visibility into which accounts are thriving, slipping, or at risk.
Health Status
- Happy customers don’t churn
Not just support tickets. Real sentiment.
Track how your customers feel using built-in feedback tools and behavior signals.
- Stay in control of your bottom line
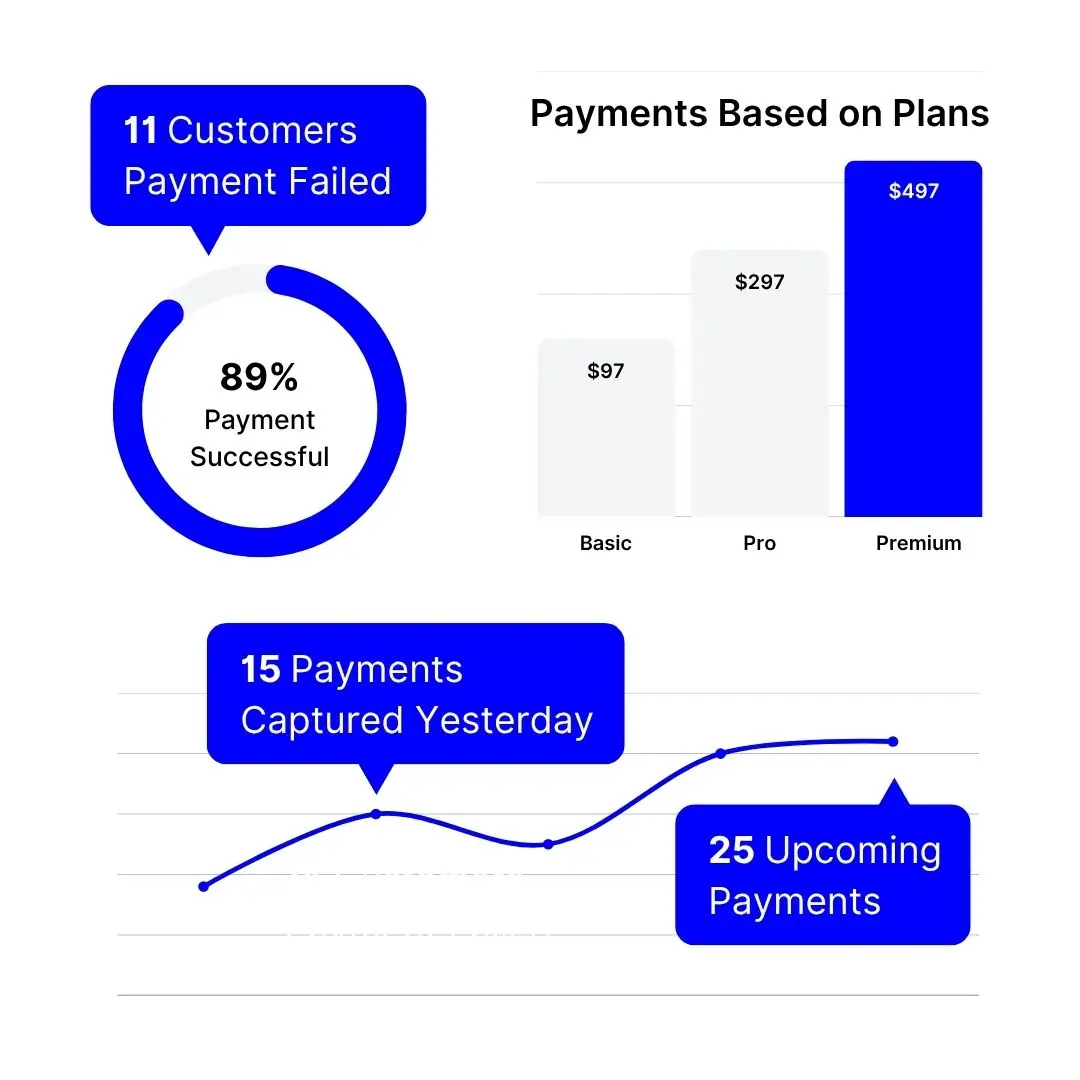
Your revenue, at a glance.
Instantly see current revenue, plan breakdowns, expected payments, and cancellations.
- Re-engage silent customers before they churn
Know who’s active and who’s gone quiet.
Monitor login trends, session time, and user behavior to catch early warning signs.
- Scale product education without lifting a finger
Trigger support when usage signals it.
If they spend too long, drop off, or ignore a feature—automatically offer help, tips, or demos.
- Make the save before it’s too late
Stop churn before it finishes processing.
Get alerted the moment someone cancels, downgrades, or hits a renewal window.
- Focus on the customers who need you most
Turn behavior into real-time risk tracking.
Logins, usage, feedback, and payments power each customer’s dynamic score.
Sub-account Activities
- Thriving
- Your CS team’s most powerful filter.
Create segments that actually help you act.
Filter users by behavior, engagement, health, plan type, or renewal status.
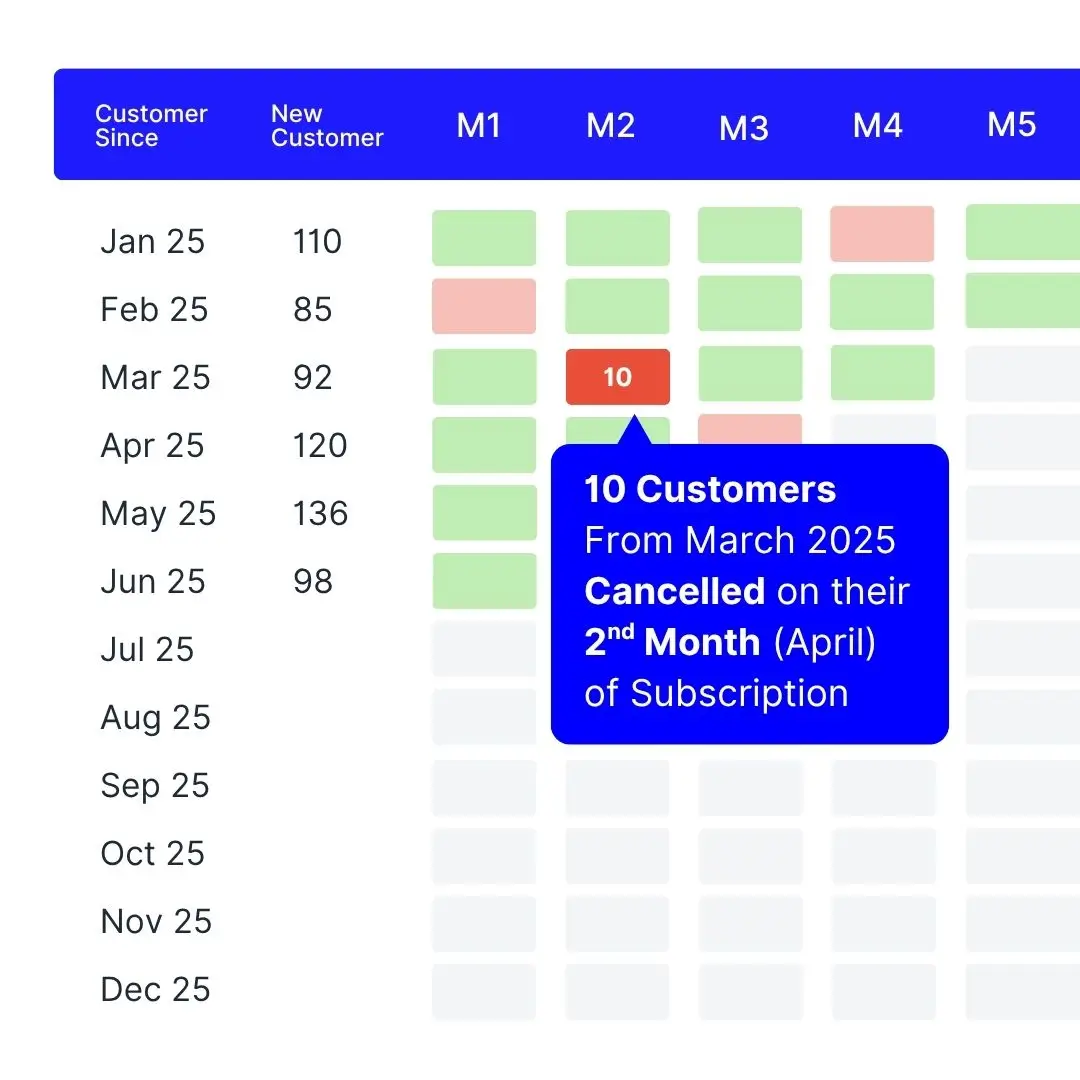
- Spot drop-off trends before they cost you
Visualize retention across every cohort.
Track monthly signup cohorts and see how engagement and churn evolve over time.
- Know who to focus on—and why
Your entire book of business, sorted smartly.
One view to see health, sentiment, usage, score, and team assignment. Filter with ease.
| Company Name | Last Updated | Login Activity | Product Adoption | Feedback (NPS) | Health Status | Assigned CSM | Actions | |
|---|---|---|---|---|---|---|---|---|
| AlphaWave | 3h ago |
5/5100%
|
15/1694%
|
😀☹️90%
|
Thriving82%
|
| ||
| BetaLink | 5d ago |
3/560%
|
9/1656%
|
😀55%
|
Steady50%
|
| ||
| BioVita | 7h ago |
5/5100%
|
12/1675%
|
🙂☹️95%
|
Thriving88%
|
| ||
| Code Sphere | 2h ago |
3/560%
|
8/1650%
|
🙂😐😀80%
|
Healthy70%
|
| ||
| Capital Flow | 2d ago |
2/540%
|
6/1638%
|
☹️😐60%
|
Healthy55%
|
| ||
| DeltaWorks | 2w ago |
2/540%
|
8/1650%
|
☹️😀30%
|
At-risk20%
|
| ||
| EpsilonSoft | 10d ago |
1/520%
|
3/1619%
|
☹️😐20%
|
At-risk15%
|
| ||
| Market Hive | 1mo ago |
1/520%
|
4/1625%
|
☹️😀😐40%
|
Steady32%
|
| ||
| Pixel Core | 3d ago |
4/580%
|
10/1663%
|
😀🙂75%
|
Healthy65%
|
| ||
| QuickSync | 8d ago |
0/50%
|
2/1613%
|
☹️25%
|
At-risk10%
|
|
Bulk Actions
Add to Workflow
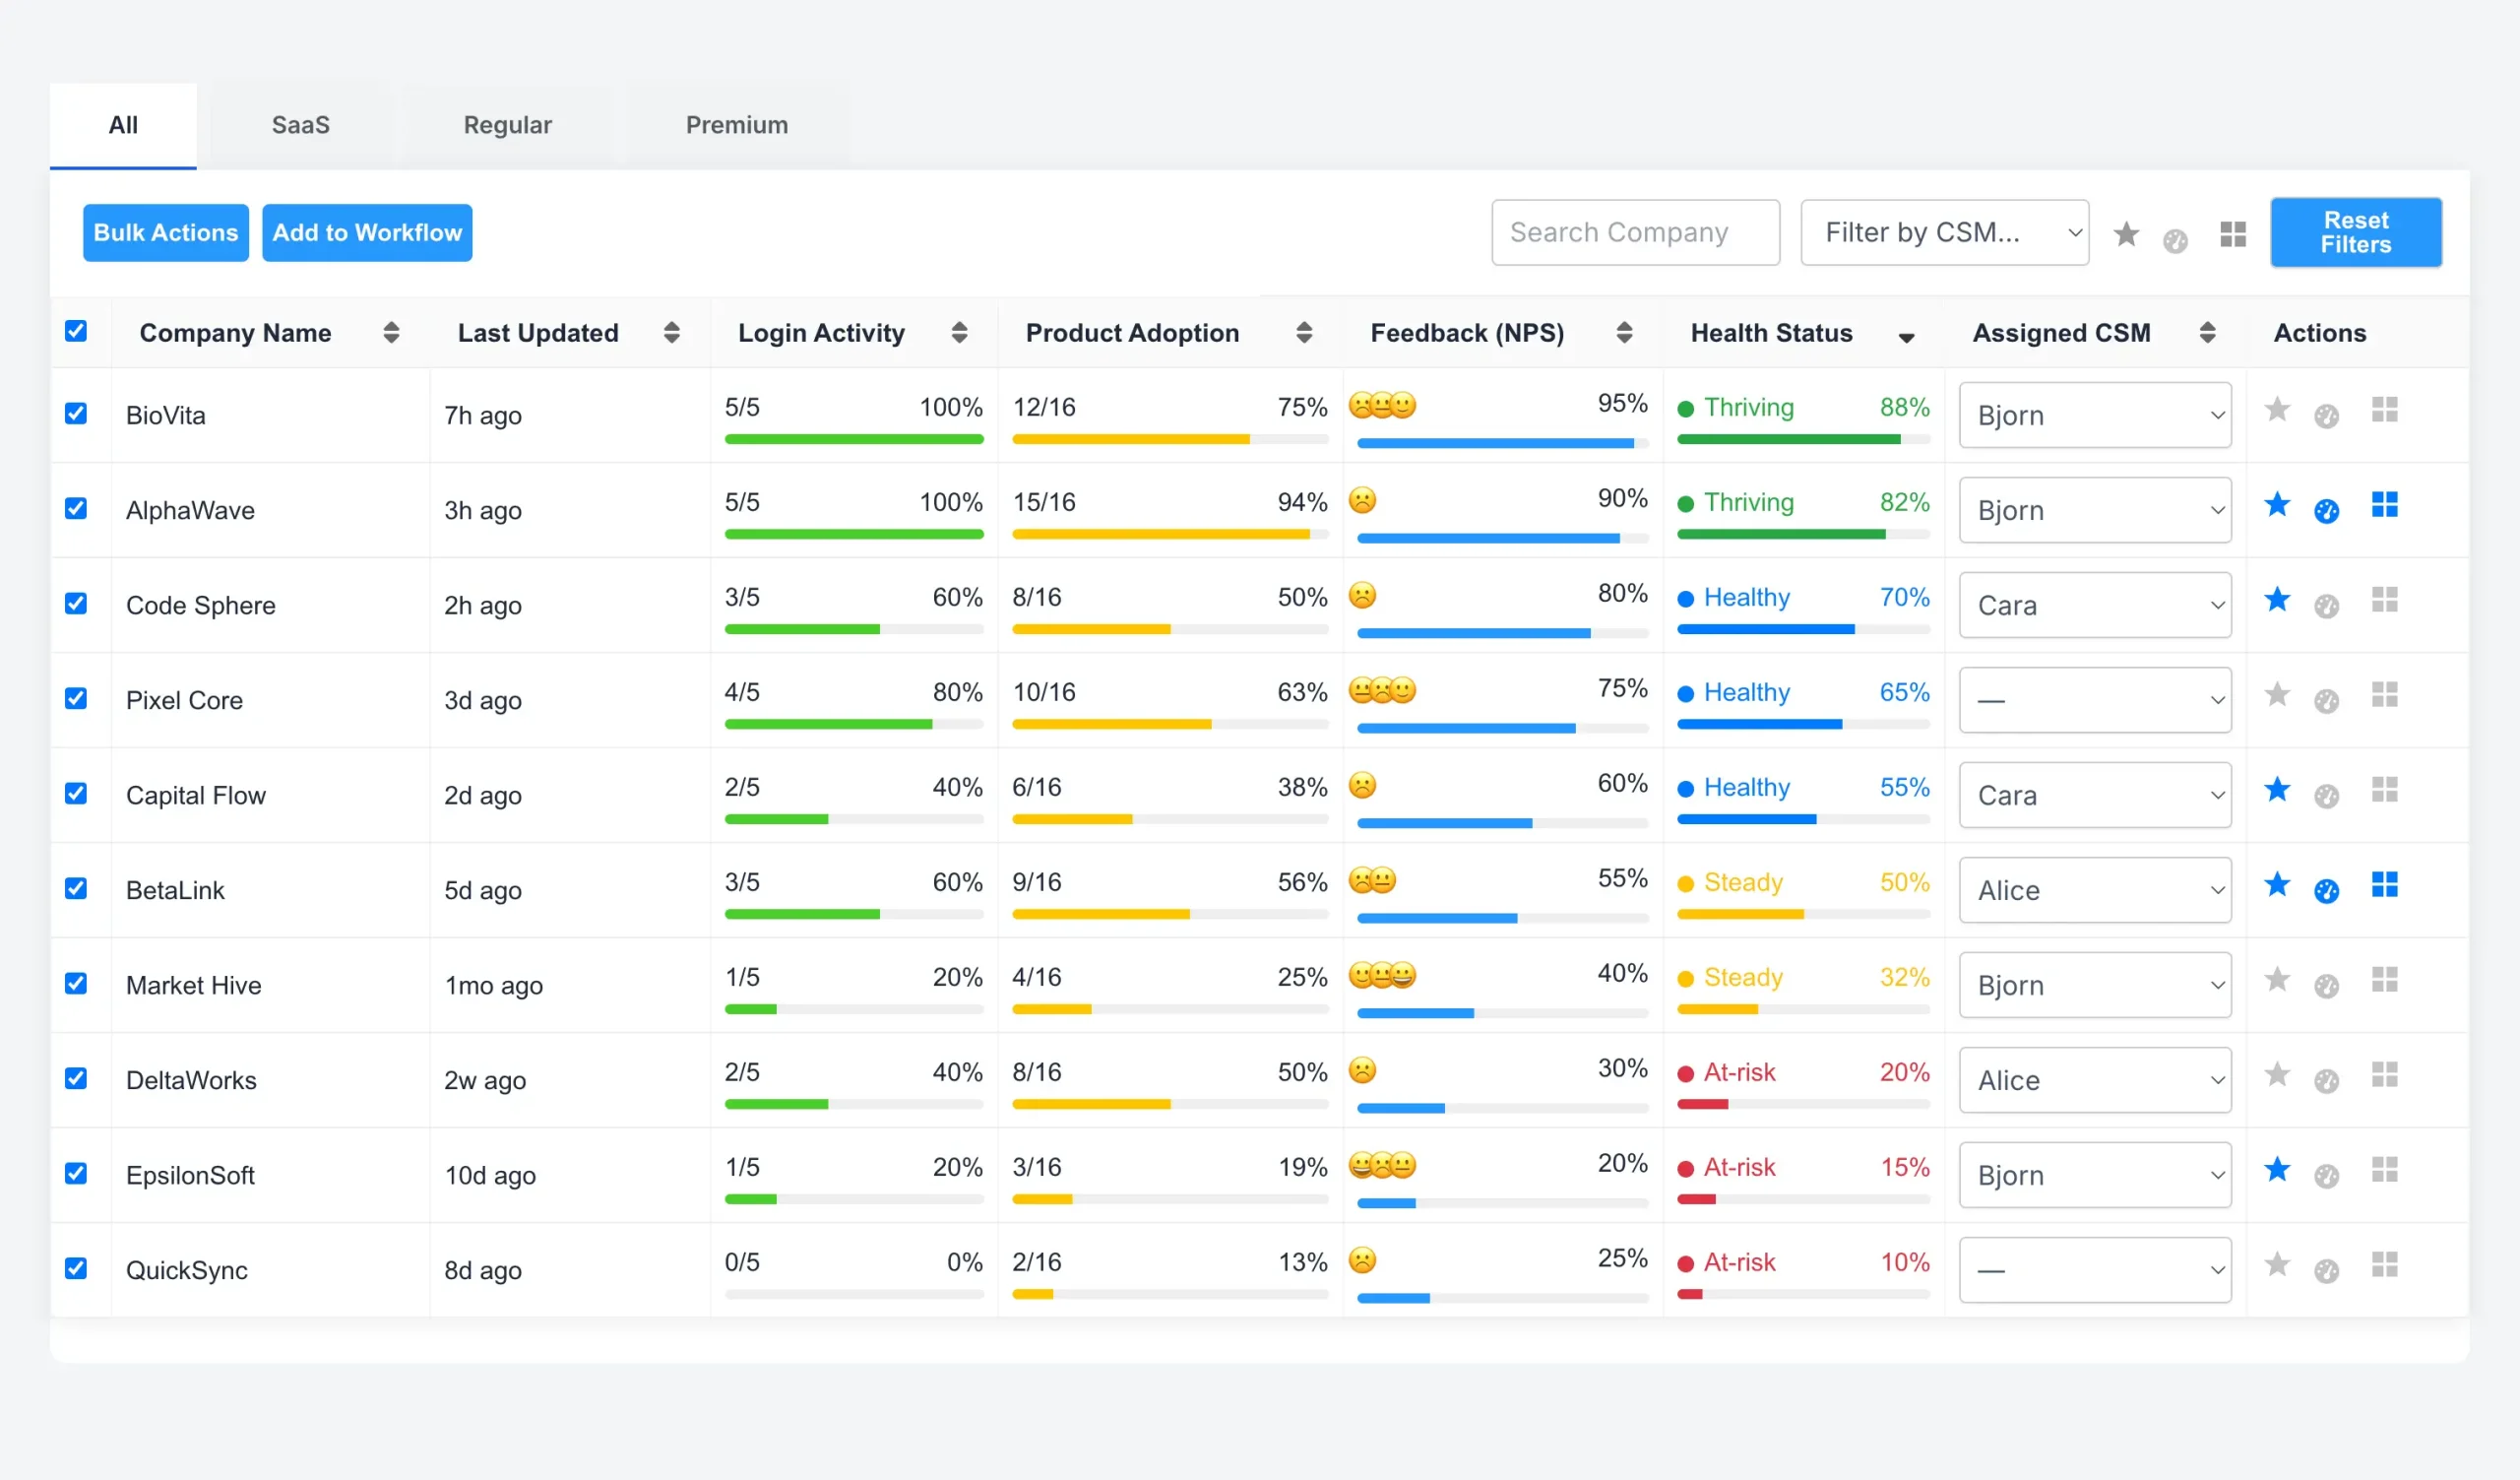
Easily manage multiple accounts with Bulk Actions, allowing you to update health status, company status, and more in just a few clicks. Plus, advanced filtering helps you quickly sort and find the data you need for better decision-making and customer management.
View and manage a list of all sub-accounts, track their status, usage, and engagement to optimize customer retention and support.
Track the Active Users count for each sub-account to identify engagement trends and improve retention.
Track which services customers are actively using to assess engagement, identify adoption trends, and optimize retention strategies.
Track user sentiment and collect valuable feedback to measure happiness levels. Understand customer satisfaction trends and take proactive steps to improve retention.
Monitor customer health status to assess engagement, satisfaction, and retention risks, ensuring proactive success management.
Assign Customer Success Manager (CSM) to sub-accounts, focusing on proactive management to enhance client engagement and revenue growth. They provide priority support, ensure access to exclusive features, and work to maximise retention and long-term success.
You don’t need 5 different tools. You need the right one
GoCSM brings visibility, automation, and insight to every customer relationship.